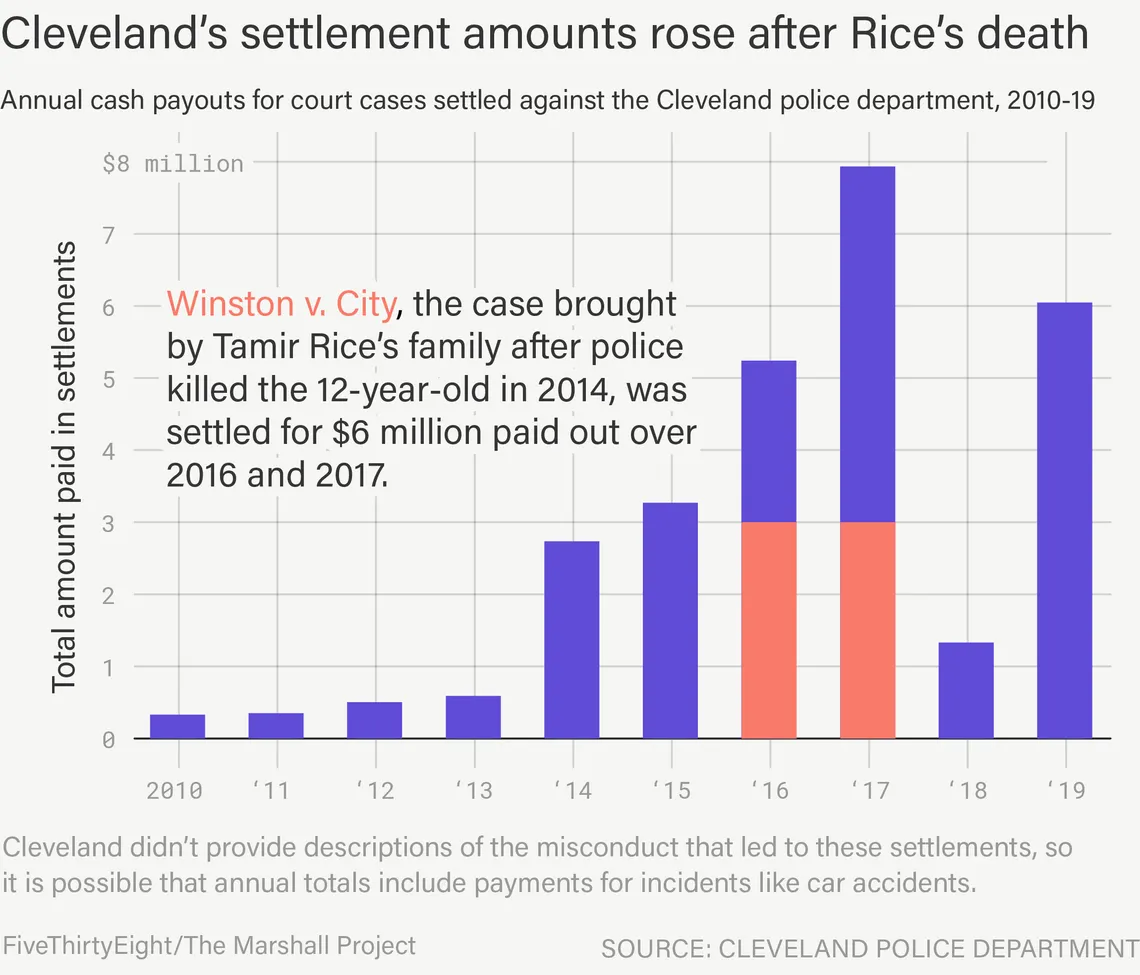
In the spring of 2016, the city of Cleveland agreed to pay $6 million to the family of Tamir Rice, the 12-year-old boy who was shot and killed by a city police officer in late 2014. It was one of the only forms of justice the grieving family was likely to receive.1 A grand jury had already opted not to charge the officers involved, so the city’s decision to settle the family’s wrongful death lawsuit for such a large amount of money was all the more significant. After the payout was announced, the Rice family said they hoped the settlement would “stimulate a movement for genuine change in our society and our nation’s policing.”
But five years later, Cleveland has paid more money in police misconduct settlements than in the five years before Rice was killed. In 2017, according to public records obtained by FiveThirtyEight and The Marshall Project, the city paid $7.9 million (including $3 million for half of the payment to the Rice family). In 2019, it paid $6 million. That’s more than the city spent on police misconduct in the entire five-year period between 2010 and 2014.2
What to make of that trend? Is it a sign that the city’s policing problems have gotten worse? Or evidence that more victims of police violence were moved to come forward? Or that the city has started to compensate people more generously for the harms they experienced? Depending on your perspective, the data could be seen as a warning that Cleveland has even more work to do—or a sign that the city had started to take police misconduct more seriously. (The city and its public records office did not respond to repeated requests for comment.)
These are crucial questions, which makes the lack of answers all the more frustrating.
As the country has witnessed episode after episode of police abuse, holding police officers accountable for misconduct has become an urgent issue. But despite increased attention, it’s still rare for police officers to face criminal prosecution. That leaves civil lawsuits as victims’ primary route for seeking legal redress and financial compensation when a police encounter goes wrong. The resulting settlements can be expensive for the city, which is generally on the hook for the payouts (meaning ultimately, most are subsidized by taxpayers), and those costs can encourage cities to make broader changes.
Successful settlements are also a helpful source of information for places that are serious about police reform. If cities and police departments want to cut down on misconduct and spend less taxpayer money, they need to know how much they’re paying for police abuse, and what kinds of incidents are most frequent and most expensive.
But police settlements are their own bramble of contradictions. Including Cleveland, we obtained public records from 31 of the 50 cities with the highest police-to-civilian ratios in the country. Our analysis shows the cities have spent more than $3 billion to settle misconduct lawsuits over the past 10 years.3 (You can access all of the data in our Observable notebook.)
But as with Cleveland, the data mostly left us with more questions than answers. Shoddy, confusing, or incomplete record-keeping combined with a host of other local factors to make it nearly impossible for us to conclude if anything was changing in any given city—much less whether those shifts were for better or worse.
Those problems, in turn, mean that it’s very difficult to know which cities are more successfully reducing police misconduct than others, and how the burden on taxpayers is shifting as a result. And although police violence has become a national problem, with President Biden now pushing for changes to the system, our analysis indicates that we’re far from being able to know if things are improving. If anything, the challenges we encountered in collecting and analyzing data on settlements are indicative of broader problems and complications in police accountability: lack of standardization, a dearth of transparency, and incomplete or missing data.
Three billion dollars sounds like a lot of money. But the vast majority—$2.5 billion over 10 years—was spent by the nation’s three largest cities, which had a combined budget of around $115 billion last year alone. Smaller cities spent much less than New York, Los Angeles or Chicago, although a significant number, including Milwaukee, Detroit and San Francisco, still spent tens of millions of dollars on police misconduct settlements over the same period.
Police misconduct settlements can be costly
Total police settlement spending in records obtained by FiveThirtyEight and The Marshall Project, along with the years of data available and the average amount spent annually on police settlements
| City▲▼ | No. of years▲▼ | Total amount▲▼ | Yearly avg.▲▼ |
|---|---|---|---|
| New York City | 10 | $1,704,120,487 | $170,412,049 |
| Chicago | 10 | 467,586,464 | 46,758,646 |
| Los Angeles | 10 | 329,925,620 | 32,992,562 |
| Washington, D.C.* | 9 | 114,841,449 | 12,760,161 |
| Philadelphia | 11 | 116,881,088 | 10,625,553 |
| Detroit | 10 | 57,702,989 | 5,770,299 |
| Milwaukee | 10 | 40,017,822 | 4,001,782 |
| Baltimore* | 5 | 18,432,748 | 3,686,550 |
| San Francisco | 10 | 27,873,298 | 2,787,330 |
| Cleveland | 11 | 28,573,475 | 2,597,589 |
| Springfield, MA** | 15 | 32,846,089 | 2,189,739 |
| Indianapolis | 10 | 13,149,775 | 1,314,977 |
| Memphis | 7 | 8,772,884 | 1,253,269 |
| Boston | 10 | 11,905,482 | 1,190,548 |
| Atlanta* | 5 | 4,761,182 | 952,236 |
| Paterson, NJ | 10 | 7,742,498 | 774,250 |
| Miami | 11 | 7,284,684 | 662,244 |
| St. Louis | 5 | 3,117,847 | 623,569 |
| Orlando | 9 | 3,611,879 | 401,320 |
| New Orleans | 10 | 3,510,642 | 351,064 |
| North Charleston, SC | 10 | 3,333,750 | 333,375 |
| Baton Rouge | 10 | 2,879,795 | 287,979 |
| Fort Lauderdale, FL | 9 | 2,471,384 | 274,598 |
| Waterbury, CT | 9 | 2,227,250 | 247,472 |
| Cincinnati | 11 | 2,472,787 | 224,799 |
| Charleston, SC | 10 | 1,520,250 | 152,025 |
| Columbia | 10 | 1,352,435 | 135,244 |
| Little Rock | 10 | 943,950 | 94,395 |
| Richmond, VA | 10 | 748,500 | 74,850 |
| Roanoke, VA | 10 | 132,500 | 13,250 |
| Cambridge, MA | 10 | 114,000 | 11,400 |
*In Baltimore, Atlanta and Washington, D.C., we rounded down the number of years because either the first or last year we received included only partial data.
**In Springfield, the total amount includes a $27 million judgment that was appealed by the city and reduced to $6.5 million after we received the data.
Source: Police Departments
You could be forgiven for looking at these findings and concluding that the cities with lower totals are doing a lot better than New York City, or even a place like Milwaukee, when it comes to police misconduct. But figuring out what’s actually going on is far from simple.
It’s entirely possible, first of all, that we’re just missing data. In many cases, the cities told us they weren’t keeping records in a form that would allow them—or anyone else—to easily analyze how much money was going out the door for police misconduct. A handful of places responded to our public records request with a sheaf of court documents and told us to figure out the totals on our own. Others sent easier-to-analyze data with the caveat that some relevant incidents might still be excluded—and then refused to elaborate on how, or why, the data was incomplete.
“There’s no rule or law about what [cities] have to collect,” said John Rappaport, a law professor at the University of Chicago who studies police misconduct payouts. That’s why, he said, it’s so challenging to make sense of a large amount of disparate information about police settlements. “It relies on an assumption that the data exists, it just needs to be collected. And that’s often just not the case.”4
Experts say that there are a host of factors that influence the number and amount of settlements in any given place. In a recent analysis, UCLA law professor Joanna Schwartz compared the Philadelphia and Houston police departments, which are similarly sized. Yet she found that Philadelphia had 10 times as many civil rights suits filed against the city and its department in a single two-year period as Houston.
She rattled off a slew of difficult-to-quantify factors as to why that might be.
- Some states have laws that are particularly protective of police officers, which raises the likelihood that lawsuits will be dismissed with no payout.
- One place—like, say, New York City—might have more civil rights lawyers who are willing to take on police misconduct cases.
- There might be formal or informal caps on how much a city will pay in a settlement.
- It’s possible that juries in some parts of the country are more willing to rule in favor of police misconduct victims, giving cities more of an incentive to settle lawsuits before they get to trial.
- The process of filing a lawsuit may be so expensive and complicated that people are only willing to wade into the legal system when they’re victims of egregious misconduct—allowing other damaging behavior to slip under the radar.
- And then, of course, officers might actually use force differently in different cities. But Schwartz thought that was unlikely to be the only (or primary) reason for the variances.
Jon Loevy, a Chicago-based civil rights attorney who has worked on police misconduct cases across the country, said that in his experience, it tends to be easier to get a higher-dollar settlement in more liberal parts of the country—both because there are more lawyers who work on police misconduct in those areas, and because the juries and judges there tend to be friendlier to civil rights claims. “If I go to Texas and litigate, the juries have different attitudes about whether the police should be found liable and if so, what the damages should be,” he said, adding that those attitudes can influence whether lawsuits are filed at all and how much they settle for.
These factors might be hard to pin down, but they can create feedback loops that have a huge impact on whether lawsuits settle and how much they settle for—or whether even they’re filed at all. And they make it even more difficult to understand whether there’s a connection between settlements and actual levels of police misconduct or the severity of misconduct—for example, what percentage of incidents involve property damage as opposed to bodily harm. Some of these problems could be solved by better record keeping—if cities separated payments for car accidents from use of force settlements, for example, we would have been able to learn a lot more about where the city’s money is going and why. But some problems will persist regardless of how good a city’s settlement data is, because these problems affect whether lawsuits are filed at all and whether they’re successful. This is what we at FiveThirtyEight and The Marshall Project call a denominator problem: Knowing the number and amount of police misconduct settlements can only get you so far if you don’t actually know how much misconduct there is in the first place.
Take Richmond, Virginia. It’s a city with a history of troubled police-community relations, but it nevertheless had very few settlements. Once we filtered out car accidents, there were only 10 payouts for police misconduct in the entire 10-year period we looked at.5 When we asked Neil Gibson, a senior assistant attorney for the city, why Richmond’s numbers were so much smaller than other jurisdictions of a similar size, he said he didn’t want to speculate. “If the city has studied the matter closely enough to provide an informed response, our office is not aware of it.”
Richmond’s low numbers could be the sign of a police department that commits relatively little misconduct. Or it could be the sign of a much more fundamental problem with the way police misconduct is tracked (or not tracked) to begin with. After all, not every act of police abuse results in a settlement—far from it, in fact.
Brandon Hasbrouck, a professor at Washington and Lee University School of Law who studies police violence, pointed out that because lawyers who work on police misconduct cases essentially work on spec—they generally only get paid if their client wins a settlement—there’s little incentive for them to take cases in places where settlements are rare.
Meanwhile, he added, it’s possible that the relationship between Richmond’s police and its residents is so bad that people simply don’t see a point in trying to get compensation. In fact, wading into the legal system in search of restitution or accountability may actually result in more trouble for police misconduct victims in places where police departments are especially powerful or defensive. “If you’re not crystal-clear in your recollections of what happened, you could end up with a criminal complaint against you,” he said. “Black people have the perception in many places that police are pretty much untouchable. So is [a lawsuit] really worth your time?”
All of these factors don’t just make it hard to figure out whether an individual city is spending more or less on misconduct—they hinder attempts to determine if certain places are doing better than others when it comes to police reform.
In our analysis, every city seemed to have its own definition of misconduct, if they had one at all. That lack of consistency is important because officers and departments get sued for a dizzying array of offenses.6 In the data we received, some of the payments were for the kind of mundane incidents you might expect from a profession that involves a lot of driving and tense physical altercations—a collision with a police car at a stop sign, an iPhone smashed as a suspect was being handcuffed. But many were much more serious—involving physical abuse of suspects, excessive force during ordinary traffic stops, unlawful arrests or searches, and even killings by police.
To get a handle on what’s happening with police misconduct, it’s important to be able to separate these types of claims. But Schwartz said that based on her research, that may not be how some city bureaucrats are using or thinking about this data, particularly in smaller places where administrative resources are scarce. “I’ve found basically that jurisdictions don’t make much effort at all to learn from these lawsuits,” she said. “There’s just no pressure for them to learn from them and then there’s no pressure to keep track of the data.”
The ability to distinguish between an accident and abuse is pretty important if you’re trying to figure out how to improve a police department, though. It’s true that even here the line can be blurry—it’s not great for trust in law enforcement if police cruisers are frequently ramming into people’s cars at traffic lights. Even so, there was enormous variation in what cities counted as misconduct at all—and that’s when we could distinguish between different categories. Five cities included no description of the allegations in the settlements; 18 included categories, but only one sent a dictionary defining how those categories were created; and seven sent more detailed summaries of the allegations, although it wasn’t clear how those were assembled or who had written them. (Were they from the plaintiff’s perspective? Or the police department’s?) Some of the data we could parse clearly contained a large number of car accidents, which we filtered out to the best of our ability. But many of the categories were genuinely ambiguous—like “personal injury,” which could include accidents and misconduct.
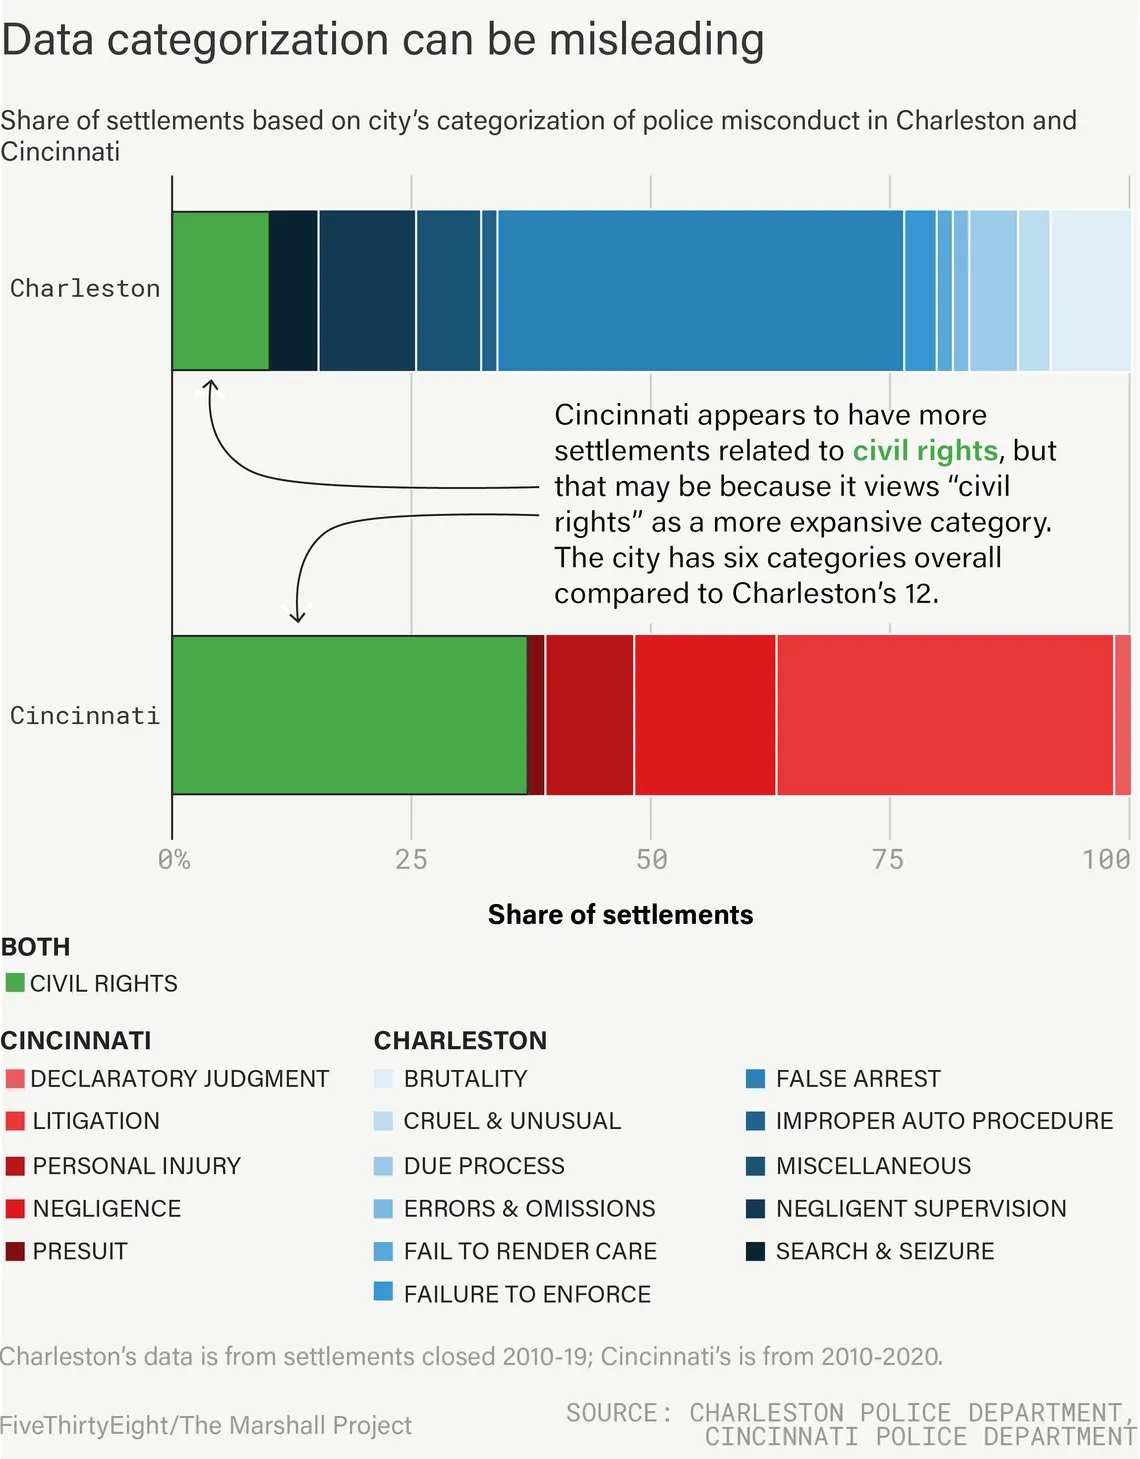
The fact that so few of the cities sent definitions made it hard to compare common categories, like “civil rights,” which cropped up in multiple cities. Some cities reported paying out much more of their total for civil rights claims than others. In Cincinnati, civil rights cases made up 37 percent of the total. In Charleston, South Carolina, they were only 10 percent.
But it’s a big leap to assume, based on that data, that Cincinnati’s police officers were more likely to commit civil rights offenses. Cincinnati, for instance, broke out the misconduct in its data set into five broad buckets, while Charleston broke its data into finer-grained categories, several of which could reasonably be classified as related to civil rights.7
This suggests that Cincinnati’s “civil rights” categorization could be quite a bit broader than Charleston’s. But we discovered that it’s impossible to even know that. A spokesperson for the state agency that oversees the South Carolina Insurance Reserve Fund, which handles Charleston’s police settlement claims, said that their categories are for internal use only and aren’t designed to match up with anyone else’s definitions. Cincinnati, by contrast, uses far fewer categories, including “litigation,” a kind of catch-all. And both the South Carolina state insurer and the Cincinnati law department said that there were no set definitions for their categories, making it literally impossible to compare to other places or even check to see if the categories are being consistently applied.
Other cities similarly lacked clear internal definitions for the categories they used. In Los Angeles, for instance, a spokesperson for the city attorney’s office told us that there was no set definition for the several dozen categories the department uses to classify misconduct. Instead, he said, “Entries are based on the expertise of the individual entering the matter into our system based on the categories.”8
We were also left scratching our heads about how to understand the data underneath the multi-year totals. Take the difference between the number of settlements each city paid out and how expensive those settlements were. For instance, Boston and Indianapolis told us they spent about the same amount of money—around $13 million—in the 10-year period we looked at. But Indianapolis had about five times as many settlements as Boston, while Boston’s median settlement was twice as high as Indianapolis’s.
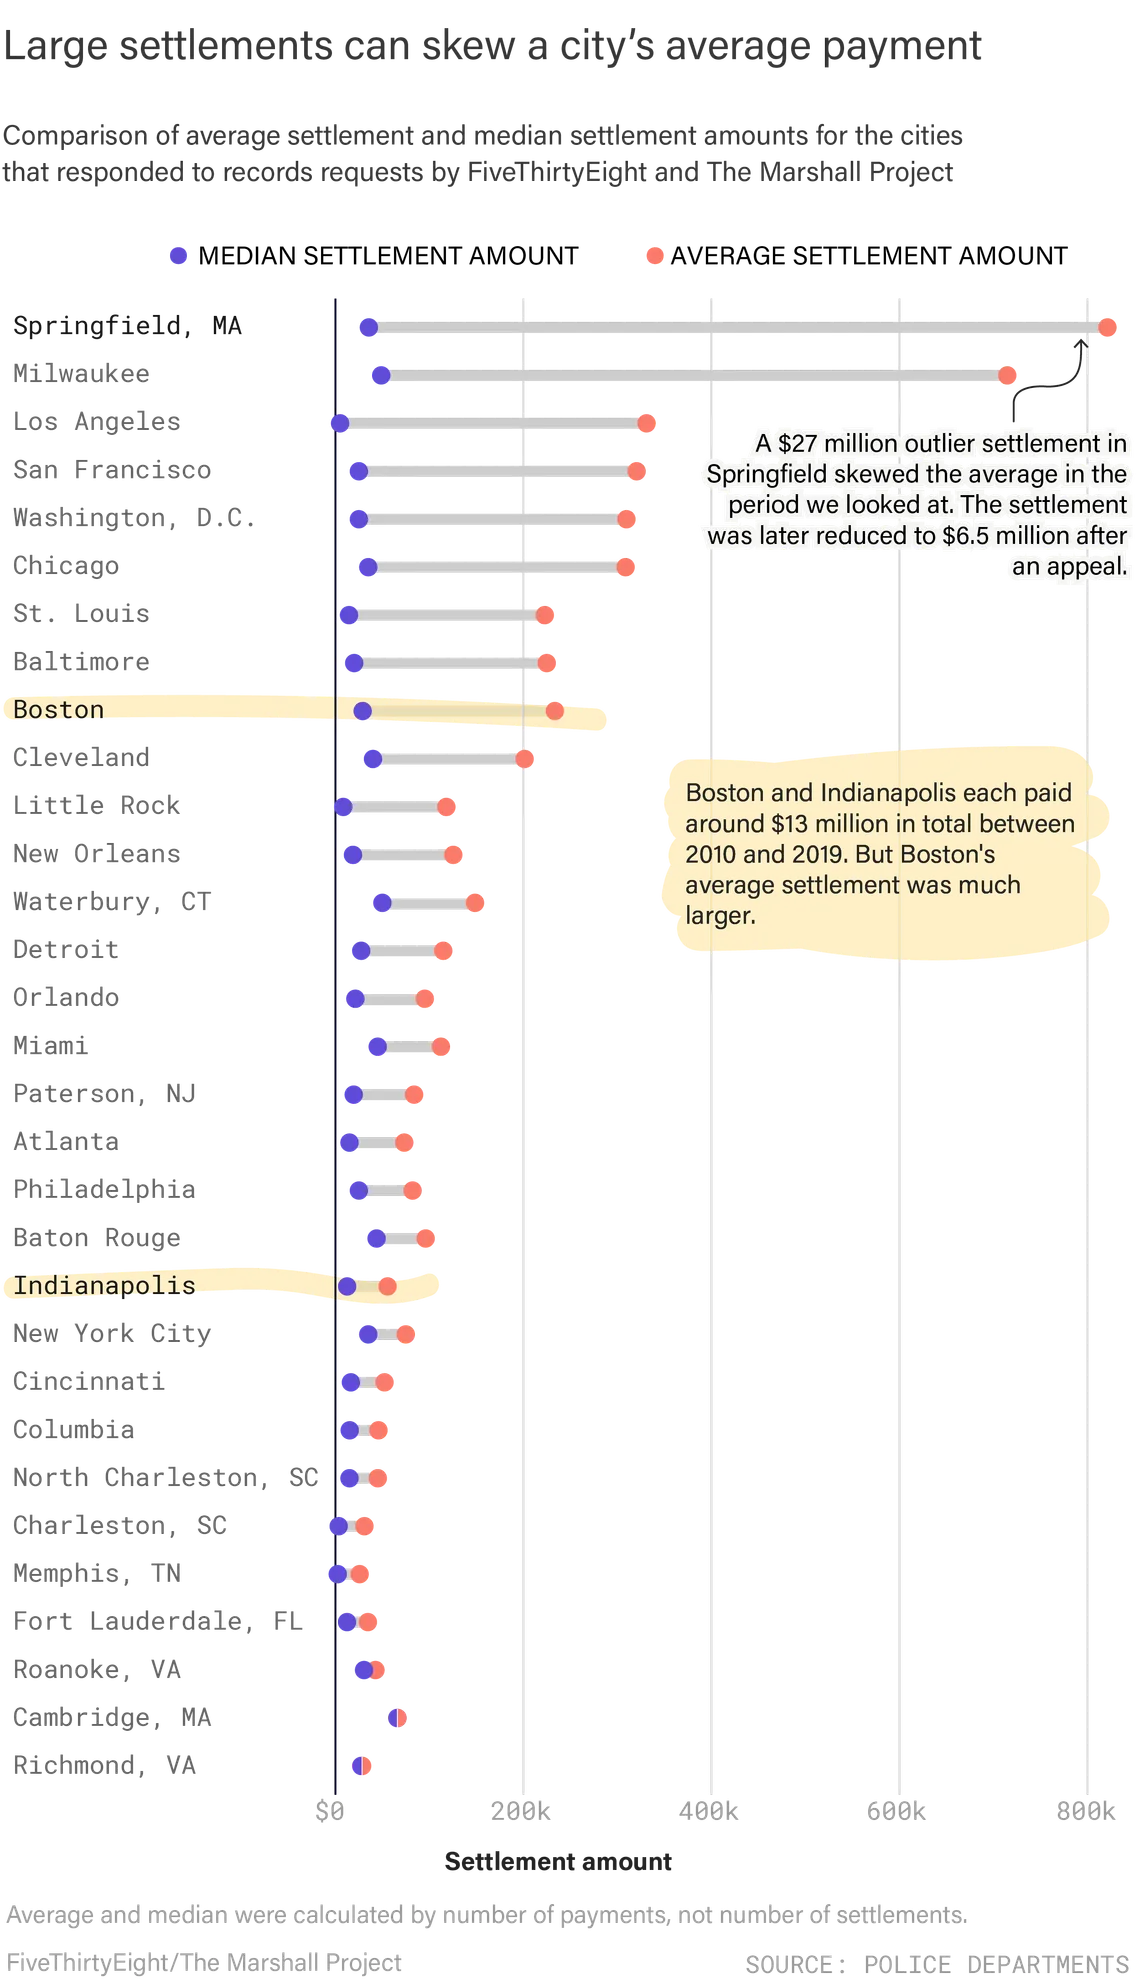
It’s impossible to draw firm conclusions from this data about what’s actually happening on the ground. Does that mean that Indianapolis police officers are committing lower-level acts of misconduct, because the cases tend to settle for less money? Or is it a sign that Boston is a place where victims of police misconduct have better lawyers and more legal leverage, and can therefore expect higher payouts? Or is there something else going on? (Boston’s mayoral office declined to comment, while a spokesperson for the city of Indianapolis said he didn’t have a “definitive” explanation for the discrepancy, but suggested that since pretrial mediation is required in both Indiana state and federal courts, misconduct lawsuits may be more likely to settle early.)
Some cities are starting to take steps to improve record-keeping and transparency. Chicago, for example, recently began publishing reports on litigation involving the police department, including information about how many lawsuits were filed and paid out. That reporting—which was required as part of a court-supervised consent decree with the state—contains more detailed categories than many of the cities we looked at, including details like how many cases involved allegations of excessive force. Going forward, that’s the kind of specificity that would make a meaningful analysis possible, particularly if multiple cities were tracking and reporting their data in the same way over a sustained period of time.
But the piecemeal nature of the data we received points back to a problem that is one of the central challenges of police reform: Police violence is a national issue that is almost entirely determined by local decision-making. Unless at least some of the 18,000 police departments in the country start recording police settlements in a similar way, the payouts will largely continue to be a black box.
Getting more uniform data would likely require states or the federal government to step in and impose some requirements, perhaps as a condition of receiving law enforcement funding. Standardized data reporting could also be a requirement of consent decrees between police departments and the federal government, which the Biden administration has indicated it will use as a tool for police reform. That kind of standard template wouldn’t just have to include information about settlements. It could also require police departments to report the number of civilian complaints they receive each year, or the number of times officers use force against civilians, or the number of people who are shot by police, none of which is currently being tracked by states or the federal government in a systematic, comprehensive way.
That kind of comprehensive, detailed data collection wouldn’t fix all—or even most—of the problems we uncovered. But without it, we’re stuck trying to assemble a puzzle where we know we’re missing some of the pieces—we just don’t know which ones, or how many. Even if we get all of the pieces, the puzzle might still be hard to solve—but at least we’d have a better shot. “Having good data is certainly not sufficient but it’s really necessary,” Rappaport said. “Because without that, even if you want to do something good with the data, it can’t tell you if what you’re doing is actually working.”
Additional reporting by Likhitha Butchireddygari, Humera Lohdi, Adria Watson, Michelle Pitcher, Monica Potts and Tom Bailey.
Graphics by Jasmine Mithani.
-
The officer who shot Rice was later fired, but for reasons unrelated to the shooting. ↩
-
Cleveland did not provide descriptions of the misconduct underlying these settlements, so it is possible that this total includes things like car accidents. ↩
-
We received data from 35 cities in total, and were able to analyze the data from 30. We could not analyze the data from Jersey City, New Jersey; Kansas City, Missouri; Shreveport, Louisiana; or Hartford, Connecticut, often because they did not provide settlement amounts or because they provided it in a format that proved very difficult to standardize. Data on the number of police per department—which is limited to sworn officers, and does not include civilian employees—is from the FBI’s 2018 Uniform Crime Reporting Program. City population figures are from the U.S. Census Bureau. ↩
-
The data we were given was also sometimes missing key information such as the date on which an incident occurred, the litigation was filed, and/or a settlement was paid out; case names and docket numbers; and the amount of money awarded. We generally kept all entries except those missing a monetary amount, but this is another factor that makes it hard to compare payouts across cities or even within cities over time. Some departments also underwent changes in data storage during this 10-year period, which may have led to inconsistencies in data collection. And because much of the information we received was the result of manual searches by city personnel, there were cases in which repeated requests led to different results, likely because of slight differences in search specifications. ↩
-
Initially, the data we received included only four police misconduct payouts. After we followed up, the city furnished another six instances of payouts for police misconduct. The initial batch of settlements was all that was in the city attorney office’s electronic filing system, and the second batch was only found when the office consulted an additional data set held by the city’s Bureau of Risk Management. The office then reconciled the two data sets. ↩
-
One source of ambiguity in our data was whether we were looking only at settled lawsuits, or if claims that were paid out before a lawsuit was even filed were also included. In many cases, the cities did not specify. We have broken out claims from lawsuits in all of the cities where we were able to do so (Atlanta, Los Angeles and Paterson, New Jersey). Some cities included jury verdicts in addition to settlements, and it is similarly unclear whether this is always indicated. In our data release we have indicated the difference where it was explicitly provided, such as in Baltimore. ↩
-
For example, Charleston’s categories include “law enforcement - civil rights” in addition to “law enforcement - false arrest” and “law enforcement - search and seizure,” even though false arrest and unlawful search and seizure are civil rights violations. ↩
-
In our public records requests, we asked each city for a data dictionary, but received detailed information about the specific categories only from New York City. ↩