In March 2020, at the beginning of the coronavirus pandemic in the United States, The Marshall Project began to track how many people were sickened and killed by COVID-19 in federal and state prisons across the country. For more than a year, working with The Associated Press, we updated the numbers every week. In June 2021, as cases were declining from their peaks and prison agencies released less information, we stopped collecting these figures. Here you’ll find a summary of how COVID-19 ravaged those in prison — both the incarcerated and employees. Download our raw data on Github and Data.world, and read more below about other sources for current data and how we collected our numbers.
This reporting was undertaken in partnership with The Associated Press.
This data is no longer updated as of June 25, 2021. For other sources of data, visit the COVID Prison Project and the UCLA Law COVID Behind Bars Data Project.
Cases
From the start of the pandemic through June 2021, at least 398,627 people in prison tested positive for the illness.
That total is a significant undercount. In the early months of the pandemic, testing was inconsistent in many prisons, leading to cases going undiagnosed. Reported cases first peaked in April 2020, when states such as Michigan, Ohio and Tennessee began mass testing of prisoners. Though later waves of the pandemic led to far higher numbers of cases, those initiatives suggested that the coronavirus had been circulating among people without symptoms in much greater numbers than previously known.
The Federal Bureau of Prisons also had a policy of removing cases and deaths from its reports. As a result, by the spring of 2021, we could no longer accurately determine new cases in federal prisons, which had more people infected than any other system.
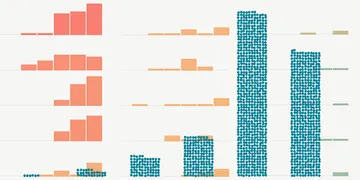
There were 398,627 cases of coronavirus reported among prisoners through June 2021.
| State | Total cases | Per 10,000 prisoners | New cases over time |
|---|---|---|---|
| Alabama | 1,662 | 787 | |
| Alaska * | 2,440 | 5,109 | |
| Arizona | 12,328 | 2,910 | |
| Arkansas | 11,425 | 6,528 | |
| California | 49,395 | 4,199 | |
| Colorado | 8,960 | 5,095 | |
| Connecticut * | 4,549 | 3,701 | |
| Delaware * | 2,064 | 4,094 | |
| Florida | 18,072 | 1,927 | |
| Georgia | 3,870 | 703 | |
| Hawaii * | 2,220 | 4,591 | |
| Idaho | 4,174 | 5,270 | |
| Illinois | 10,914 | 2,955 | |
| Indiana | 3,719 | 1,381 | |
| Iowa | 4,899 | 5,741 | |
| Kansas | 6,117 | 6,239 | |
| Kentucky | 7,909 | 6,503 | |
| Louisiana | 3,209 | 2,130 | |
| Maine | 197 | 921 | |
| Maryland | 4,482 | 2,206 | |
| Massachusetts | 2,574 | 3,230 | |
| Michigan | 26,694 | 6,992 | |
| Minnesota | 4,229 | 4,750 | |
| Mississippi | 1,399 | 792 | |
| Missouri | 5,899 | 2,292 | |
| Montana | 1,138 | 2,524 | |
| Nebraska | 983 | 1,749 | |
| Nevada | 4,576 | 3,695 | |
| New Hampshire | 460 | 1,891 | |
| New Jersey | 4,806 | 2,606 | |
| New Mexico | 2,990 | 4,539 | |
| New York | 6,600 | 1,543 | |
| North Carolina | 10,106 | 2,950 | |
| North Dakota | 635 | 4,180 | |
| Ohio | 9,847 | 2,013 | |
| Oklahoma | 7,455 | 2,987 | |
| Oregon | 3,617 | 2,502 | |
| Pennsylvania | 11,476 | 2,465 | |
| Rhode Island * | 1,250 | 4,675 | |
| South Carolina | 3,373 | 1,862 | |
| South Dakota | 2,344 | 6,333 | |
| Tennessee | 6,701 | 3,100 | |
| Texas | 34,716 | 2,478 | |
| Utah | 3,474 | 5,035 | |
| Vermont * | 464 | 2,802 | |
| Virginia | 9,112 | 3,125 | |
| Washington | 6,254 | 3,623 | |
| West Virginia | 1,632 | 2,742 | |
| Wisconsin | 10,989 | 4,658 | |
| Wyoming | 905 | 4,055 | |
| Federal | 49,324 | 2,866 |
Source: The Marshall Project and Associated Press weekly data collection from state and federal prison agencies. Download our data.
Deaths
The first known COVID-19 death of a prisoner was in Georgia, when Anthony Cheek died on March 26, 2020. Cheek, who was 49 years old, had been held in Lee State Prison near Albany, an early hot spot for the disease. In the ensuing 15 months, at least 2,714 other prisoners died of coronavirus-related causes. Only one state — Vermont — reported no deaths of a prisoner attributed to COVID-19.
There were 2,715 deaths related to coronavirus reported among prisoners through June 2021.
| State | Total deaths | Per 10,000 prisoners | New deaths over time |
|---|---|---|---|
| Alabama | 66 | 31 | |
| Alaska * | 5 | 10 | |
| Arizona | 65 | 15 | |
| Arkansas | 52 | 30 | |
| California | 227 | 19 | |
| Colorado | 29 | 16 | |
| Connecticut * | 19 | 15 | |
| Delaware * | 13 | 26 | |
| Florida | 221 | 24 | |
| Georgia | 93 | 17 | |
| Hawaii * | 9 | 19 | |
| Idaho | 6 | 8 | |
| Illinois | 88 | 24 | |
| Indiana | 51 | 19 | |
| Iowa | 19 | 22 | |
| Kansas | 16 | 16 | |
| Kentucky | 48 | 39 | |
| Louisiana | 36 | 24 | |
| Maine | 1 | 5 | |
| Maryland | 31 | 15 | |
| Massachusetts | 21 | 26 | |
| Michigan | 141 | 37 | |
| Minnesota | 12 | 13 | |
| Mississippi | 23 | 13 | |
| Missouri | 48 | 19 | |
| Montana | 6 | 13 | |
| Nebraska | 6 | 11 | |
| Nevada | 57 | 46 | |
| New Hampshire | 3 | 12 | |
| New Jersey | 53 | 29 | |
| New Mexico | 28 | 43 | |
| New York | 35 | 8 | |
| North Carolina | 55 | 16 | |
| North Dakota | 1 | 7 | |
| Ohio | 135 | 28 | |
| Oklahoma | 56 | 22 | |
| Oregon | 42 | 29 | |
| Pennsylvania | 139 | 30 | |
| Rhode Island * | 2 | 7 | |
| South Carolina | 42 | 23 | |
| South Dakota | 7 | 19 | |
| Tennessee | 42 | 19 | |
| Texas | 273 | 19 | |
| Utah | 18 | 26 | |
| Vermont * | — | 0 | |
| Virginia | 56 | 19 | |
| Washington | 13 | 8 | |
| West Virginia | 12 | 20 | |
| Wisconsin | 32 | 14 | |
| Wyoming | 4 | 18 | |
| Federal | 258 | 15 |
Source: The Marshall Project and Associated Press weekly data collection from state and federal prison agencies. Download our data.
What's happening in your state
Given the huge differences in how many people have been tested for the virus, the effects of the pandemic varied widely between different prison systems. The first reported cases began popping up in Massachusetts and Georgia by March 20, 2020. At the end of 2020, Rhode Island started to offer the COVID-19 vaccine to its prisoners, and at least 45 other systems followed suit. By the end of June, more than 54% of prisoners nationwide had received at least one dose of the vaccine. Here, you can choose to view the data for any state prison system and see how its numbers compare. For a summary of the number of cases in facilities run by the Federal Bureau of Prisons, choose the “Federal” option.
Testing data represents the number of tests administered, not the number of individuals who have been tested. Some states do not report tests until results have returned, which may create a delay in test counts.
Prison staff
While we know more about how prisoners were getting sick, another group of people were also at risk in these facilities: correctional officers, nurses, chaplains, wardens and other workers. We know less about how the coronavirus affected them, though they have the potential to carry it both into facilities and back out to their communities, because many weren’t systematically tested.
In our final week of data collection, 13 states — Connecticut, Illinois, Indiana, Maryland, Michigan, Missouri, North Carolina, North Dakota, Oklahoma, South Dakota, Texas, Virginia and West Virginia — released information on the number of their staff members tested for the coronavirus. Among state corrections departments that reported how many staff tested positive, most stressed that the count included only the employees who voluntarily reported a diagnosis, often in the course of calling out sick.
By the end of June 2021, 114,237 prison staff members tested positive, and new cases hit an all-time high the week of Dec. 22, 2020. Prisons publicly reported 209 deaths among staff.
There were 114,237 cases of coronavirus reported among prison staff through June 2021.
There were 209 deaths related to coronavirus reported among prison staff through June 2021.
Source: The Marshall Project and Associated Press weekly data collection from state and federal prison agencies. Download our data.
The staff members in your state
We know very little about how many staff are tested, and in some states, it’s not clear how many people work in prisons. What we do know is that in several states, prison employees began to get sick before the people they oversee. Using this tool, you can view the data for any prison system and see how the numbers compare. For a summary of the number of cases in facilities administered by the Federal Bureau of Prisons, choose the “Federal” option.
The Marshall Project no longer tracks data on the coronavirus in our prison systems. For other sources of data, you can visit the COVID Prison Project and the UCLA Law COVID Behind Bars Data Project. If you have questions or updates to our data to share, please contact us at info+covidtracker@themarshallproject.org. We have published the raw data we collected at data.world, in partnership with The Associated Press, and on GitHub. You can download the data to examine for yourself or to use in your research. If you do use our data, please let us know.
Methodology
Starting on March 26, 2020, reporters from The Marshall Project collected data on COVID-19 tests administered to people incarcerated in all state and federal prisons, as well as the staff in those facilities. Working with The Associated Press, we requested this data every week from state departments of corrections and the Federal Bureau of Prisons; however, not all departments could provide data for the exact dates requested. These numbers have been grouped by the week the data was collected.
For six states with unified prison and jail systems — Alaska, Connecticut, Delaware, Hawaii, Rhode Island, Vermont — we count testing and case numbers from both detainees awaiting trial and sentenced prisoners. Similarly, in Maryland, several pretrial facilities in Baltimore City are included in the figures.
To estimate the rate of infection among prisoners, we collected population data for each prison system before the pandemic, roughly in mid-March of 2020, and then in April and June and each month after that. Beginning the week of July 28, 2020, we updated all prisoner population numbers, reflecting the number of incarcerated adults in state or federal prisons. Before that, population figures may have included additional people, such as prisoners housed in other facilities, which were not captured in our COVID-19 data. In states with unified prison and jail systems, we included both detainees awaiting trial and sentenced prisoners.
We calculate the rates of infection and death to allow for the easiest comparison across prison systems. Because population snapshots do not account for movement in and out of prisons since March 2020, and because many systems have significantly slowed the number of new people being sent to prison, it’s difficult to estimate the total number of people who have been held since March 2020. To be conservative, we calculate our rates of infection using the largest prisoner population snapshots we had during this period.
Infection rates for the general population are calculated using case counts from the COVID-19 Data Repository by the Center for Systems Science and Engineering at Johns Hopkins University and population data from the U.S. Census Bureau. Before March 11, 2021, we used general population case numbers from the now-shuttered COVID Tracking Project.
Corrections departments in Indiana, Kansas, Montana, North Dakota and Wisconsin reported COVID-19 testing and case data for juvenile facilities; West Virginia reported figures for juvenile facilities and jails. For consistency of comparison with other state prison systems, we removed those facilities from our data that had been included before July 28, 2020. Pennsylvania’s COVID-19 data included testing and cases for those who had been released on parole. We removed these tests and cases for prisoners before July 28, 2020 from the data. The parole staff cases remain. Until early November 2020, West Virginia’s Department of Corrections and Rehabilitation did not disaggregate its staff numbers by type of facility. After they began providing itemized numbers on staff cases, we only included staff numbers from prisons and work release sites. We went back to past weeks and estimated the staff breakdown based on the total number of staff in each sector.
Early weeks of data for Vermont included multiple tests of the same prisoner. Starting on May 13, 2020, the data now accurately reflects the number of individual prisoners tested in Vermont.
In Texas, updates to the data overcounted the number of employee tests for the weeks of May 13, May 20 and May 27, 2020, after the state redesigned its website and how it classified tests for employees. These figures have been amended.
Beginning the week of June 2, 2020, we moved our data collection up by one day. Data for that week represents a six-day count of cases between May 28 and June 2, 2020.
For the week of July 14, 2020, Michigan undertook an audit of cases and found duplicates that needed to be removed from its unique numbers. As a result, the number of cases dropped by 5 percent from the previous week. To estimate case counts for previous weeks, we have adjusted the original figures by that percentage. As an additional result of the audit, the prisoner test numbers fell by 717.
Starting with the week of July 21, 2020, South Carolina’s Department of Corrections began to report cases — but not testing counts — for prisoners held in “other locations,” such as county jails and hospitals.
The number of staff deaths in Maine for the week of July 21, 2020 was wrong. It should have been 0 and has been corrected.
In the week of Aug. 4, 2020, the Federal Bureau of Prisons began to report four deaths of people who had been released to home confinement, under the supervision of halfway houses. We do not include those deaths in our totals, because their testing and case totals do not include people on home confinement. Testing figures do not include private prisons.
In mid-August 2020, Pennsylvania began reporting cases for prisoners and staff in community correction facilities. We have included these cases starting with numbers as of Aug. 18, 2020, and have updated inmate population figures to add individuals held in community corrections facilities. The number of individuals recovered among both staff and prisoners doesn't count individuals in community corrections facilities.
The total number of prisoner cases we reported dropped on Aug. 28, 2020, when we incorporated a data update from New Jersey that removed about 4% of cases in earlier weeks. New Jersey updated its prisoner case totals to remove cases where a prisoner tested negative for COVID-19 after initially testing positive. To estimate case counts for previous weeks, we have adjusted the original figures by that percentage.
For most weeks before Sept. 15, 2020 in Georgia, the prisoner cases and recoveries inadvertently counted some cases in private prisons and county facilities twice. These figures have been corrected throughout the data.
The number of staff cases we initially reported for Sept. 22 and Sept. 29, 2020, in Massachusetts incorrectly counted 100 additional cases in the state. Thus, this also showed too many staff cases nationally. We have updated the figures and charts with the accurate total for both of those weeks.
The number of prisoner deaths reported for Oct. 27, 2020 in Delaware was incorrect and should have been 11, not 17. It has been updated here.
The number of new staff cases for the week of April 13, 2021 rose significantly, largely made up of cases from Pennsylvania, which began to publish numbers again after stopping for several months, leading to the appearance of a large weekly increase.
At the beginning of May 2021, Massachusetts conducted an audit of its testing and cases, and as a result revised its prisoner case numbers down by roughly 450 from the week before. We then estimated the case counts for all previous weeks to account for the change.
Starting in mid-May 2021, we began using data from the non-partisan Texas Justice Initiative to count COVID-19 deaths in Texas prisons. The organization counts deaths in Texas Department of Criminal Justice facilities based on reports filed with the state’s attorney general. You can examine the Texas Justice Initiative’s data on its website.
Prior to late-June of 2021, the percentage of prisoners who had received at least one shot of a vaccine inadvertently omitted systems that only reported those who had been fully vaccinated. We updated this calculation, sending the number from 46% to 54%.
We ceased collecting data in the week of June 22, 2021, though we will continue to add updates for that week from prison systems that are late to report the information.
Reporting by Katie Park and Tom Meagher
Graphics by Gabe Isman and Katie Park
Additional reporting by Cary Aspinwall, Keri Blakinger, Jake Bleiberg, Peter Buffo, Andrew R. Calderón, Maurice Chammah, Andrew DeMillo, Eli Hager, Jamiles Lartey, Claudia Lauer, Nicole Lewis, Weihua Li, Humera Lodhi, Colleen Long, Ilica Mahajan, Joseph Neff, Michelle Pitcher, Alysia Santo, Beth Schwartzapfel, Damini Sharma, Colleen Slevin, Christie Thompson, Abbie VanSickle, Adria Watson, Andrew Welsh-Huggins.